Introduction to Data Mining

Showing posts with label theory. Show all posts

Monday, October 30, 2017

Just what is Big Data ??


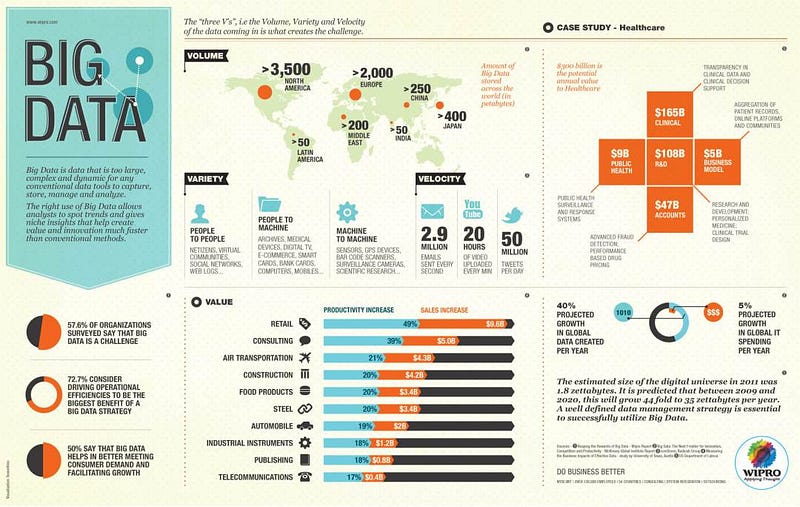
Big data is the collection of data that is part of our daily lives. It is the hundreds of million e-mails, likes on Facebook, and tweets we post online. It is the hundreds of thousands of photographs that go live on the internet each day. The industry itself is one that is growing at a breakneck pace. In 2013 big data accounted for a $10.2 billion industry, but is estimated to reach an astonishing $54.3 million this year.
Big data does not necessarily focus on the amount of data that is used though. On the contrary, it can refer to what organizations do with this data. It is the analysis of this data, processing information to make more informed decisions, and reviewing trends to make better execute strategic business moves.
The concept behind big data isn’t a new one either. While you’ve likely just started to hear the term, the process of gathering information and storing it has been around for decades. It wasn’t until Doug Laney who is a renowned industry analyst touched on the volume of data, the velocity of data, and the variety of data that we had a vision closer to our modern trend. Expanding on his statement, we also note that there are other essential factors like complexity of data and variability that are a critical part of the analytical process.
In our modern world, the data that is around is always growing. There is currently no end in sight to where this big data will go and we will continue to discover and create new ways to store and analyze the data that is there. Perhaps most surprising is that despite the sheer amount of data that is out there, only a small percentage of it is regularly analyzed. That means that there is still a world of information out there that can be processed and the statistics from it can be used to further propel the understanding of data that is there.
What is important to note is that big data isn’t about the vast amount of data is there. It’s true the numbers are staggering, but there is much more to this. But when someone talks about big data, the focus is on what they can take and pull from the information. It is the analysis of the different aspects of it. This information will allow businesses to determine how information can be better processed so they can reduce their standard operating costs, reduce processing time, and discover new ways to optimize the data that they are collecting. Over a period of time, this will also allow individuals to make better decisions and to avoid failures and other problematic concerns that may be faced along the way.
Big data will remain a pivotal part of the future. It impacts the buying habits of our customers, determining the risk doing business with individuals and companies out there, and avoiding fraud before it happens. All while reviewing data that potentially helps us to further expand our reach and success for years to come.
Source:https://medium.com/@billsoftnet/just-what-is-big-data-7c0ab5479b5d

What is a data warehouse anyway?


The business intelligence world breeds plenty of jargon and acronyms. This story is about the core idea of what a data warehouse is, and what the basic methods of construction, and information delivery are.
This article focuses on tangibles: databases, data processes, reports. Things that have real existence in a business intelligence solution. There’s plenty of worthy ideas and concepts to stack on top of that: methodology, metrics, data access policies, roll-out plans, technology and vendor choices among others. I’m not talking about any of those today. If you’re looking at the field of business intelligence from the outside, it looks like a sticky confusing mess. A miasma of methodology, marketing terms and jargon. That’s because it is.
Everyone touting jargon and buzzwords outside a BI conference likely just tries to impress you. Don’t be impressed. The core idea behind a basic data warehouse is simple.
This article explains the basic structure of a business intelligence solution. When you, in your own time, look up the definition of any BI jargon that is thrown your way, the explanation will be likely in terms of the basic structure you’ll see explained in this article.

Why would you want a data warehouse?

Let’s start with the pain point a data warehouse addresses. Successful companies grow and reach a point where it’s impossible to gain consolidated insight into business metrics. The reason is simple. The company runs multiple operational systems: accounting, sales, project management, customer support, ops. Each system is separately owned by a different department, or even outsourced. And each is designed to perform different operational tasks. These systems usually do not share or exchange data. Some systems also do not keep a history of records, focusing on maintaining current state instead.
Sooner or later it becomes somebody’s job to manually query operational systems, and to their best ability prepare a consolidated spreadsheet report. Once it becomes clear that this approach is error-prone and does not scale, companies start looking to automate it: a business intelligence initiative is born.

What does a data warehouse do?

The technical implementation of a business intelligence project does three fundamental things:
  • extract data from the various operational systems
  • save that data into a single database
  • provide a way to conveniently query said data for the purpose of analysis
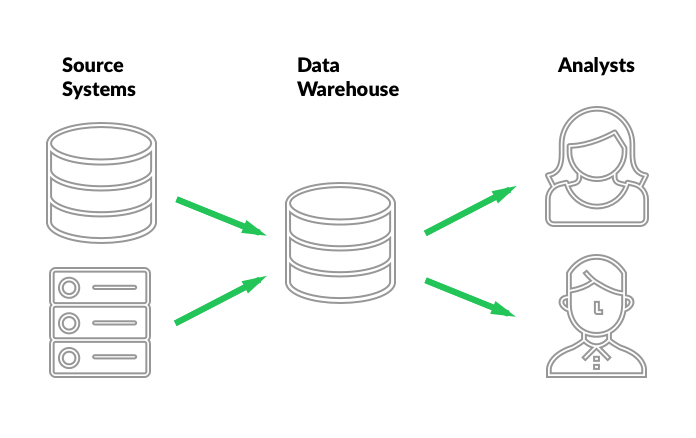
The database containing the consolidated input from the operational systems is the data warehouse. Acolytes of different methodologies might disagree, claiming that the data warehouse is not a database, but a process, or that it is the structure of the database, not the database itself. If you’re just getting your feet wet in the field, don’t spend much time arguing semantics. In the real world, outside of academic discourse, the central database containing consolidated data is referred to as the data warehouse.


The basic concept of a data warehouse

The overwhelming BI jargon stems from differences in implementation and the nature of analysis performed on the resulting data. The details of howdata is extracted, how it is stored, how it is made available for queries, and just how and when the analysis happens gives rise to a plethora of diverse approaches, methodologies and technical solutions. Each approach proposing a unique way of generating value.

How does the data move into the data warehouse?

Data needs to be extracted, transformed into a suitable format, and then loaded into the data warehouse database. Extract, Transform, and Load. ETL. Whatever the technology, tooling or method behind it, ETL refers to a process that moves data around, potentially altering its format or content in-flight. A more general term is data integration. The methodology used for building your data warehouse is going to prescribe a data model. The ETL process transforms source data to fit that model.

It all starts by collecting things in one place

Let’s zoom in on the beginning of the process: data extraction. It turns out that accessing operational data sources is hard. No overwhelming technical difficulty, really. But go ask for full read access on an production database. The answer is ‘no’ with three exclamation marks, before you’ve even finished your request. And for good reasons. Security, compliance, data privacy, performance impact of extraction, all that and more will all be part of the discussion.
In the end it’s likely that the owner of the source system agrees to schedule some sort of data dump for the BI process to pick up at a secure location. Most of the time data extraction is performed by the owner of the system, and the ETL starts by reading the exported data.
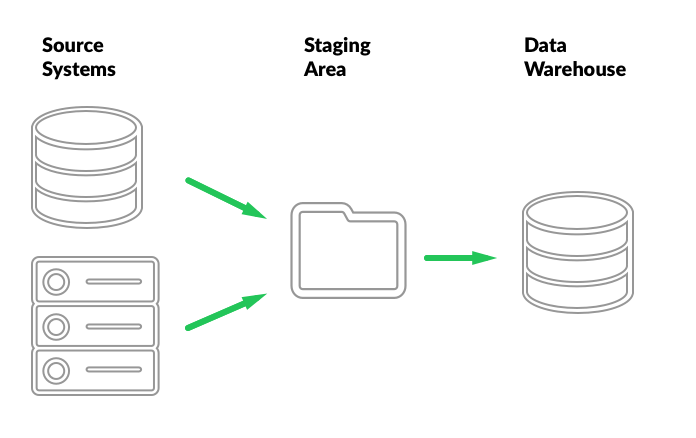
It stands to reason that all source data exported for a particular load cycle should be collected in one place, and possibly archived after the data warehouse is loaded. That place is called the staging area.


Source system exports are first collected in a staging area

Giving users the information they need

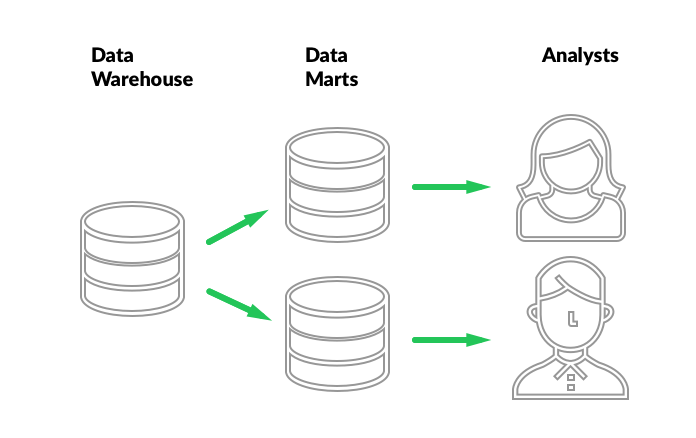
Let’s zoom in on the end of the process, where the value of the data warehouse is realized. The data warehouse’s primary function is to historize and store data accurately. There are plenty of ways to go about it. Debates about the merits and evolution of methodologies are anything but idle. One thing there is broad consensus on, is that no matter how you structure it, a data warehouse good at storing historized data correctly and efficiently is either difficult to maintain or difficult to query correctly. As a result, a common approach is to build a data warehouse that is correct, efficient, and relatively straightforward to load, but not trivial to query. The data warehouse is then supplemented by a set of independent, easy-to-query databases that are extracted from it. These databases are called data marts. They are often qualified as disposable data marts, because their entire content can be generated from information stored in the data warehouse at any time.


A DWH with data marts extracted for analysis

Data marts have several key properties that make them attractive:
  • The ETL to build and maintain a data mart is an order of magnitude simpler than the ETL to load the data warehouse. Data marts are easily created, changed, and discarded as analysis requirements change.
  • Data marts can expose simple, focused views suitable for specific use cases without overburdening their users with complexity inherent in a complete data warehouse data model.
  • Data marts can be built to satisfy technical requirements of reporting and analysis tools. Users are free to choose reporting tools that best suit their needs without introducing vendor-dependent complexity into the data warehouse.
  • Data marts can use technology different from the technology of the data warehouse. While a data warehouse is often best maintained in a traditional relational database, data marts often benefit from a column store database. Column store databases are particularly effective at running analytical queries. Analytical queries that take minutes or hours on a relational database often finish virtually instantly or within seconds on a column store. The trade-off is that column stores are particularly slow, or outright incapable of, retrieving or updating individual records, but that is not the primary function of a data mart.

Connecting analytics tools

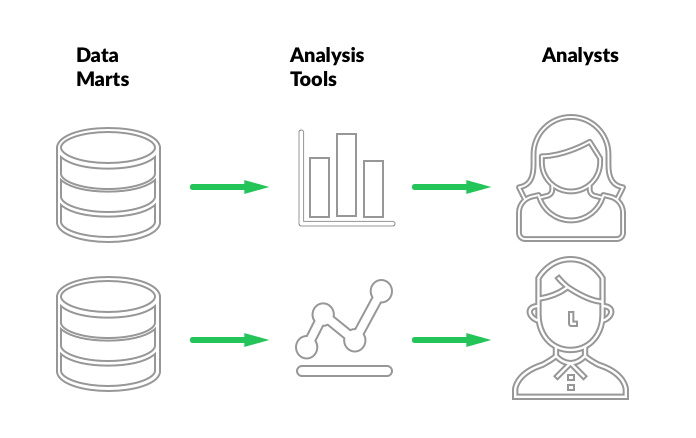
At the end of the process, analytics tools connect to data marts, allowing users to interact with the data.


Analytics tools connect to data marts to deliver insights

There are plenty of analytics tools out there. Some generate reports, some are good at dashboards, some are running prepared queries, some are interactive and support data exploration, some are browser-based, some are desktop-based. The sky is the limit and your use-case and budget determine your choices here.
Vendors of analytics tools often assume you’ve built a data warehouse and data marts already. In their marketing they’ll tell you that their tool makes all the difference for your BI success, and as far as that relates to end-user experience, roll-out, and adaption, they may well be right. But do not believe that these tools generate much value outside of that. They don’t build a data warehouse for you.
The value inherent in your data warehouse is not created by these tools, it’s merely exposed by them. If the information in your data warehouse is not useful, no amount of silver-lining or interactivity an analytics tool adds can compensate for that fact. The value of a data warehouse is in the correctness, completeness, consistency, and accessibility of the information therein. That value is determined by the quality of the data your source systems keep, and the ability of your data warehouse to correlate data from different systems. The reporting tools deliver this value to your teams. Nothing more, nothing less.

Conclusion

If you’re thinking about building a business intelligence solution for your company, I’d recommend sticking to the basic structure. There’s plenty of details to get wrong when doing it for the first time, so it’s advisable to make sure at least one team member has solid BI background. Technology choices, methodology, implementation details, and communication can each make or break a successful BI initiative.
Do not waste much time chasing the buzzwords of the week. What to expect from your BI initiative is going to depend mostly on the quality of the data you have, how your roll it out to your teams, and how you act on what you learn from it. The methodology and vendor choices are going to make a difference in cost of ownership, ability to adapt to change, and ability to include and correlate new data sources.
By Slawomir Chodnicki

Source https://blog.twineworks.com/what-is-a-data-warehouse-anyway-3c5af58dd27e

Sunday, October 29, 2017

Market Research; Data mining concepts and techniques for beginners


Big data is everywhere we look these days. Businesses are falling all over themselves to hire ‘data scientists,’ privacy advocates are concerned about personal data and control, and technologists and entrepreneurs scramble to find new ways to collect, control and monetize data. We know that data is powerful and valuable. But how?

This article is an attempt to explain how data mining works and why you should care about it. Because when we think about how our data is being used, it is crucial to understand the power of this practice. Without data mining, when you give someone access to information about you, all they know is what you have told them. With data mining, they know what you have told them and can guess a great deal more. Put another way, data mining allows companies and governments to use the information you provide to reveal more than you think.

Data mining allows companies and governments to use the information you provide to reveal more than you think.

To most of us data mining goes something like this: tons of data is collected, then quant wizards work their arcane magic, and then they know all of this amazing stuff. But, how? And what types of things can they know? Here is the truth: despite the fact that the specific technical functioning of data mining algorithms is quite complex — they are a black box unless you are a professional statistician or computer scientist — the uses and capabilities of these approaches are, in fact, quite comprehensible and intuitive.

For the most part, data mining tells us about very large and complex data sets, the kinds of information that would be readily apparent about small and simple things. For example, it can tell us that “one of these things is not like the other” a la Sesame Street or it can show us categories and then sort things into pre-determined categories. But what’s simple with 5 datapoints is not so simple with 5 billion datapoints.

And these days, there’s always more data. We gather far more of it then we can digest. Nearly every transaction or interaction leaves a data signature that someone somewhere is capturing and storing. This is, of course, true on the internet; but, ubiquitous computing and digitization has made it increasingly true about our lives away from our computers (do we still have those?). The sheer scale of this data has far exceeded human sense-making capabilities. At these scales patterns are often too subtle and relationships too complex or multi-dimensional to observe by simply looking at the data. Data mining is a means of automating part this process to detect interpretable patterns; it helps us see the forest without getting lost in the trees.


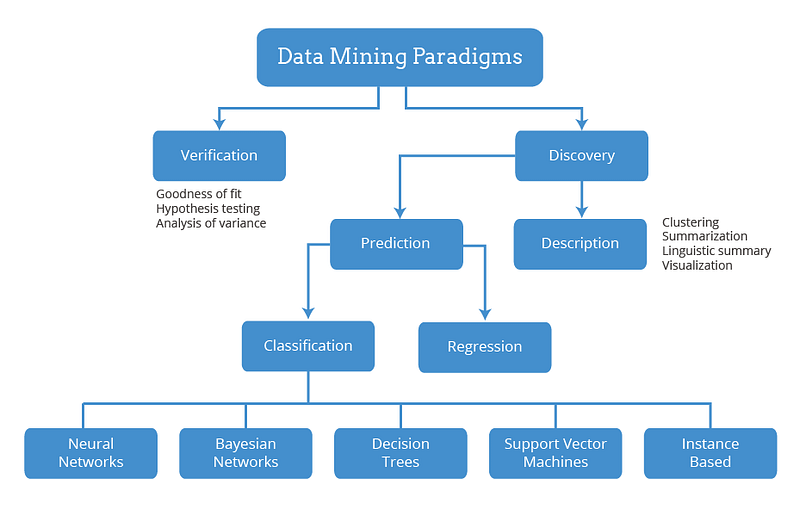
Discovering information from data takes two major forms: description and prediction. At the scale we are talking about, it is hard to know what the data shows. Data mining is used to simplify and summarize the data in a manner that we can understand, and then allow us to infer things about specific cases based on the patterns we have observed. Of course, specific applications of data mining methods are limited by the data and computing power available, and are tailored for specific needs and goals. However, there are several main types of pattern detection that are commonly used. These general forms illustrate what data mining can do.

Anomaly detection : in a large data set it is possible to get a picture of what the data tends to look like in a typical case. Statistics can be used to determine if something is notably different from this pattern. For instance, the IRS could model typical tax returns and use anomaly detection to identify specific returns that differ from this for review and audit.

Association learning: This is the type of data mining that drives the Amazon recommendation system. For instance, this might reveal that customers who bought a cocktail shaker and a cocktail recipe book also often buy martini glasses. These types of findings are often used for targeting coupons/deals or advertising. Similarly, this form of data mining (albeit a quite complex version) is behind Netflix movie recommendations.

Cluster detection: one type of pattern recognition that is particularly useful is recognizing distinct clusters or sub-categories within the data. Without data mining, an analyst would have to look at the data and decide on a set of categories which they believe captures the relevant distinctions between apparent groups in the data. This would risk missing important categories. With data mining it is possible to let the data itself determine the groups. This is one of the black-box type of algorithms that are hard to understand. But in a simple example — again with purchasing behavior — we can imagine that the purchasing habits of different hobbyists would look quite different from each other: gardeners, fishermen and model airplane enthusiasts would all be quite distinct. Machine learning algorithms can detect all of the different subgroups within a dataset that differ significantly from each other.

Classification: If an existing structure is already known, data mining can be used to classify new cases into these pre-determined categories. Learning from a large set of pre-classified examples, algorithms can detect persistent systemic differences between items in each group and apply these rules to new classification problems. Spam filters are a great example of this — large sets of emails that have been identified as spam have enabled filters to notice differences in word usage between legitimate and spam messages, and classify incoming messages according to these rules with a high degree of accuracy.

Regression: Data mining can be used to construct predictive models based on many variables. Facebook, for example, might be interested in predicting future engagement for a user based on past behavior. Factors like the amount of personal information shared, number of photos tagged, friend requests initiated or accepted, comments, likes etc. could all be included in such a model. Over time, this model could be honed to include or weight things differently as Facebook compares how the predictions differ from observed behavior. Ultimately these findings could be used to guide design in order to encourage more of the behaviors that seem to lead to increased engagement over time.


The patterns detected and structures revealed by the descriptive data mining are then often applied to predict other aspects of the data. Amazon offers a useful example of how descriptive findings are used for prediction. The (hypothetical) association between cocktail shaker and martini glass purchases, for instance, could be used, along with many other similar associations, as part of a model predicting the likelihood that a particular user will make a particular purchase. This model could match all such associations with a user’s purchasing history, and predict which products they are most likely to purchase. Amazon can then serve ads based on what that user is most likely to buy.

Data mining, in this way, can grant immense inferential power. If an algorithm can correctly classify a case into known category based on limited data, it is possible to estimate a wide-range of other information about that case based on the properties of all the other cases in that category. This may sound dry, but it is how most successful Internet companies make their money and from where they draw their power.


This Article by Benang Merah Komunikasi

Source : https://medium.com/@BenangMerahHQ/market-research-data-mining-concepts-and-techniques-for-beginners-36eebf9e5fb